Infographics
June 4, 2019
Sewer failures, pipeline blockages, the overloading of manholes and flooding of community lands put people’s lives at risk and lead to the degradation of both natural and built environments. IMQS offers municipalities a coherent solution that tackles sewer management challenges by harnessing the information and digital tools provided by the IMQS Sewer Infrastructure Module.
September 30, 2017
The Internet of Things (IoT) describes an emerging interconnected world of “things where new technologies and Big Data analytics are revolutionising our way of life. For […]
August 4, 2017
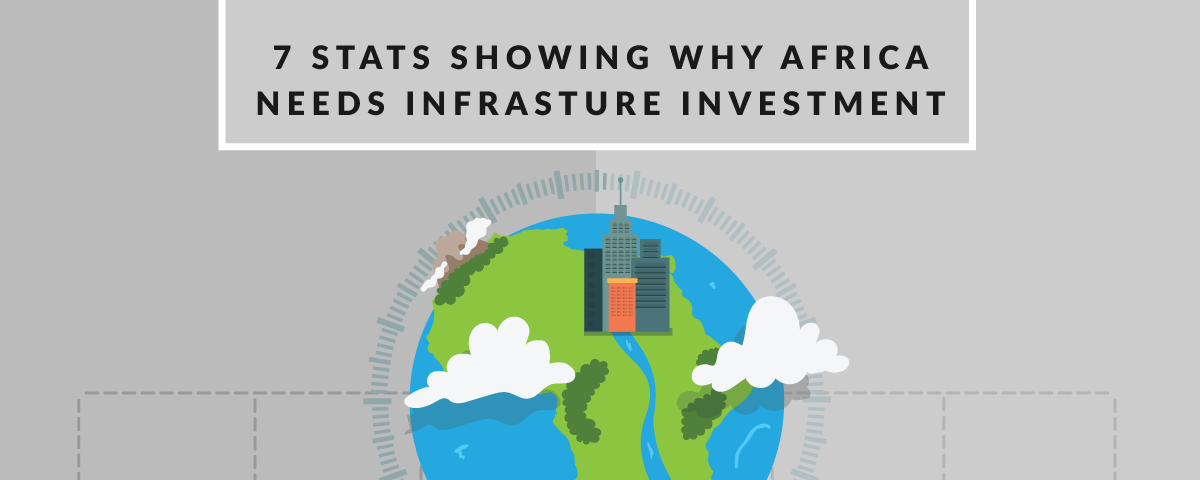
Research released in 2016 by the non-partisan, pan-African research network, Afrobarometer, is telling of Africa’s need for greater investment in infrastructure. Find out more about it […]
March 12, 2017
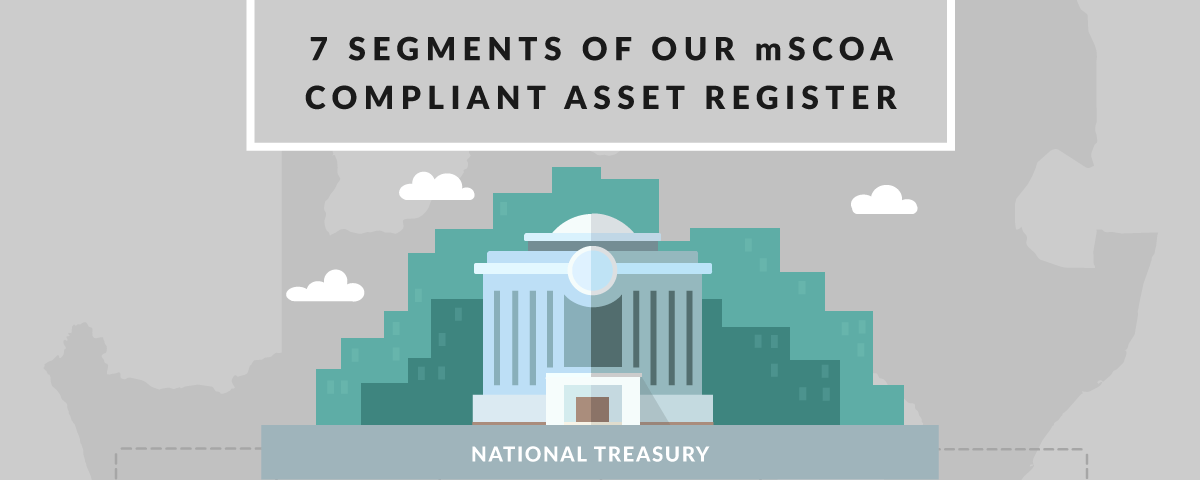
mSCOA is a financial-reporting regulatory reform that will come into full effect on 1 July 2017 that standardises all municipal accounting practices and reporting across South […]
January 12, 2017
How can you improve infrastructure-related operations and maintenance with minimal cost and effort? The answer lies in Mobile Asset Verification Services! Watch this short video now […]
December 21, 2016
With the help of smart technologies, municipalities can harness the principles of integrated asset life-cycle management to build smarter and more resilient cities. In this infographic […]
November 24, 2016
How does IMQS’s Water Demand Management Module support the Four Pillars of Water Conservation and Demand Management?
October 22, 2016
IMQS builds specialised, GIS-centric software for the Infrastructure Asset Management (IAM) market. This means that we are committed to conceptualising and constructing solutions for real world […]
September 22, 2016
Electricity is the lifeblood of economic development. Utilities across the world are challenged with the detrimental effects of electricity theft. In order for utilities to effectively […]
August 29, 2016
The use of sensors to monitor water distribution networks in (near) real-time can strongly increase the ability to make informed decisions regarding the management and maintenance […]


